September Monthly Closed Real Estate Data
The Settling-In Period: A Turn Toward Stability
The Monthly Data
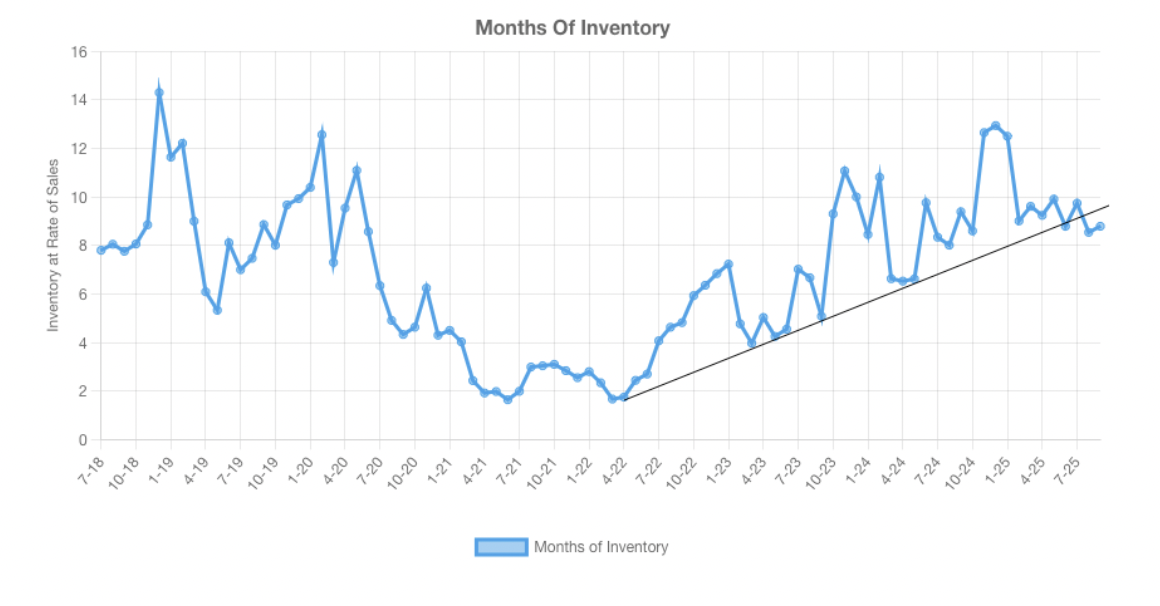
The data suggests that the residential real estate market from Key West to Big Pine Key may be entering a settling-in period, with the worst of the recent volatility appearing to be behind us. The upward trend in inventory, as depicted in the first image, has shown signs of collapsing, with the months of inventory leveling off rather than continuing to climb steeply. This stabilization indicates that the rapid influx of new listings has slowed, potentially signaling the end of the most challenging phase for sellers, who faced an oversaturated market with prolonged days on market (DOM) and softening prices.
This settling-in period reflects a market that is finding its footing, with key indicators such as the absorption rate and DOM stabilizing or showing early signs of bottoming. The increase in sold listings by 17.9% in September 2025 compared to the previous year, alongside a modest rise in active listings, suggests that demand is beginning to catch up with supply in certain segments. While challenges remain, particularly in the luxury market, the data points to a potential bottoming of activity, offering hope for a more balanced market in the near future as buyer confidence may gradually return.As we move forward, this settling-in phase could pave the way for clearer signals of recovery. The softening of new listings and the stabilization of inventory levels hint at a market adjusting to current economic conditions, such as interest rates and seasonal factors. Monitoring these trends closely will be crucial to confirm whether this period marks the beginning of a sustained stabilization, providing a foundation for both buyers and sellers to plan their next moves with greater certainty.
Real Estate Market Analysis: Key West to Big Pine – September 2024 to September 2025
The residential real estate market from Key West to Big Pine Key continues to evolve, showing signs of stabilization as it transitions toward a more balanced or buyer-friendly market. This analysis, based on the market summary data, highlights key trends in active listings, new listings, pending and sold listings, pricing, absorption rates, days on market (DOM), and sales distribution across price ranges from September 2024 to September 2025. The market reflects a growing inventory, softening prices in higher segments, and steady demand in mid-range properties, creating opportunities for strategic buyers and sellers.
The Analysis:
Key Metrics and Trends
Inventory Levels (Active Listings)
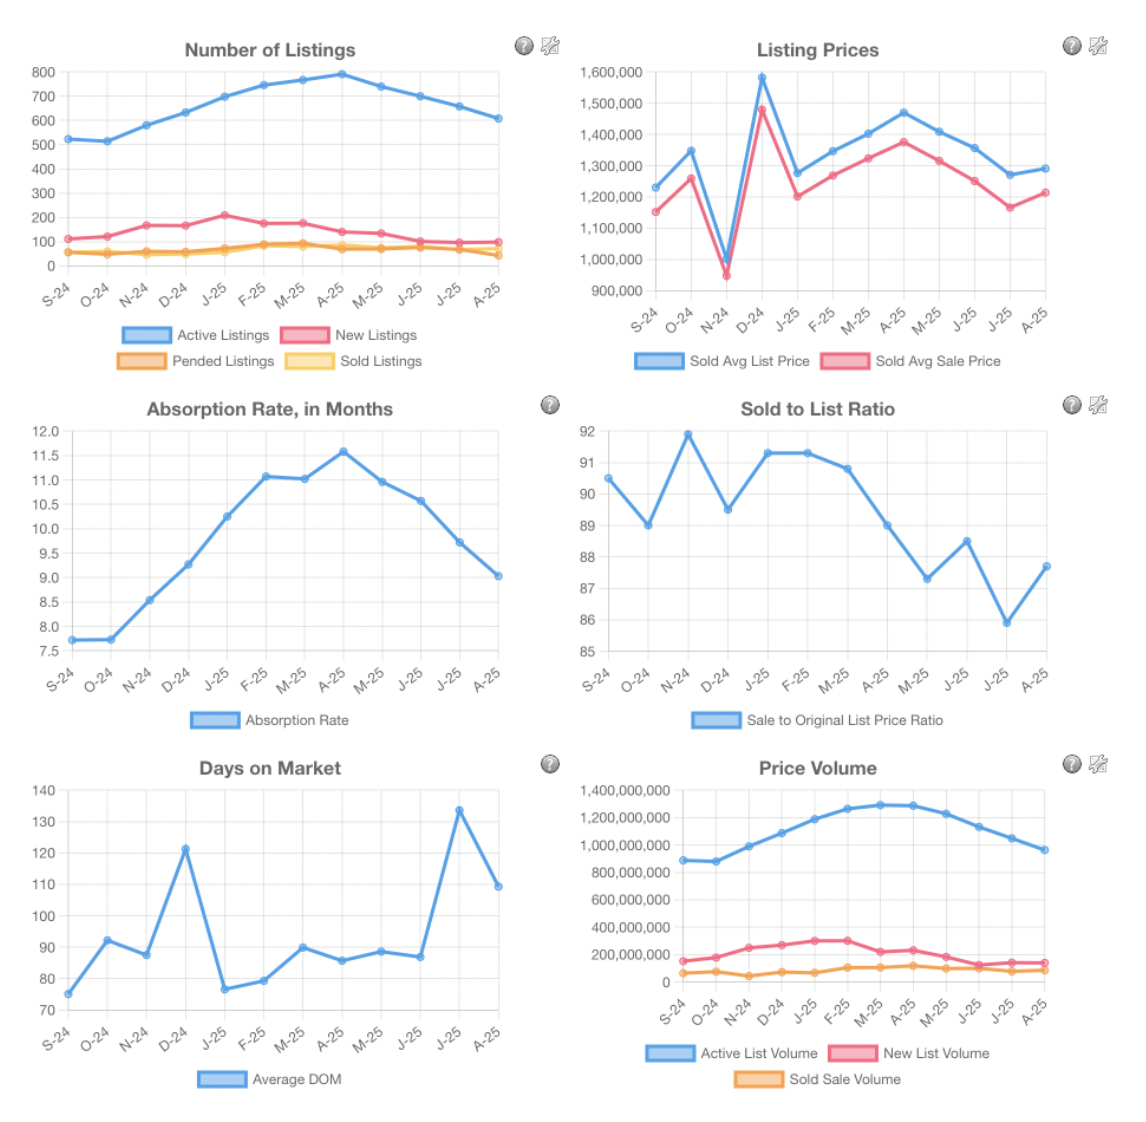
Trend: Active listings increased from 523 in September 2024 to 577 in September 2025, a 10.3% rise. Year-to-date (YTD) 2025 active listings total 1,837, up 6.0% from 1,733 in 2024.
Analysis: The growth in inventory is notable in the $450,000–$999,999 range (131 listings, 22.7% of total in September 2025), with significant YoY increases in the $450,000–$499,999 (+114.3%) and $950,000–$999,999 (+63.6%) ranges. Higher-end listings ($3,750,000–$3,999,999) saw declines.
Implication: Rising inventory suggests a buyer’s market, offering more options and potential price stabilization, particularly in the luxury segment.
New Listings
Trend: New listings decreased from 111 in September 2024 to 73 in September 2025, a 34.2% decline. YTD 2025 new listings total 1,200, down 1.2% from 1,214 in 2024.
Analysis: New listings in September 2025 are concentrated in the $900,000–$1,999,999 range (28 listings, 38.4% of total), with growth in the $1,100,000–$1,199,999 (+300%) range. Declines in higher-end listings ($1,400,000–$1,599,999, -66.7%) indicate caution among luxury sellers.
Implication: The sharp drop in new listings suggests sellers are holding back, possibly awaiting better market conditions.
Pending Listings
Trend: Pending listings fell from 56 in September 2024 to 42 in September 2025, a 25.0% decline. YTD 2025 pending listings total 632, down 6.4% from 675 in 2024.
Analysis: Declines are evident in the $550,000–$599,999 (-66.7%) and $800,000–$849,999 (-100%) ranges, while growth in the $1,100,000–$1,199,999 (+300%) range shows some upper-mid strength.
Implication: Reduced pending activity indicates buyer caution, potentially due to higher inventory or financing challenges.
Sold Listings
Trend: Sold listings increased from 56 in September 2024 to 66 in September 2025, a 17.9% rise. YTD 2025 sold listings total 665, up 0.5% from 662 in 2024.
Analysis: Sales in September 2025 are concentrated in the $500,000–$999,999 range (29 listings, 43.9% of total), with strong YoY growth in the $950,000–$999,999 (+300%) and $500,000–$549,999 (+150%) ranges. Higher-end sales ($2,000,000+) declined.
Implication: Resilience in the mid-price segment contrasts with softening luxury sales, likely due to affordability concerns.
Pricing Trends
Average List Price (Actives): Decreased 5.78% from $1,697,209 in September 2024 to $1,599,112 in September 2025. YTD 2025 average list price is $1,535,120, down 4.38% from $1,605,450 in 2024.
Average Sale Price (Solds): Dropped 13.35% from $1,151,883 in September 2024 to $998,138 in September 2025. YTD 2025 average sale price is $1,242,554, down 6.14% from $1,323,906 in 2024.
Median Sale Price (Solds): Fell 6.42% from $895,000 to $837,500. YTD 2025 median sale price is $900,000, down 6.93% from $967,000.
Sale-to-Original-List-Price Ratio: Improved from 89.0% to 94.7%, reflecting strong buyer offers.
Analysis: Softening prices in higher segments contrast with stable mid-range demand, with buyers paying closer to asking prices.
Implication: Buyers benefit from price declines, while mid-range sellers maintain pricing power
Absorption Rate
Trend: The absorption rate rose from 7.72 months in September 2024 to 8.55 months in September 2025, a 10.75% increase. YTD 2025 absorption rate is 10.31 months, up 17.29% from 8.79 in 2024.
Analysis: An absorption rate above 6 months indicates a buyer’s market, with 8.55 months signaling growing inventory relative to demand.
Implication: Buyers have more negotiating power, while sellers face increased competition.
Days on Market (DOM)
Trend: Average DOM increased from 75 days in September 2024 to 128 days in September 2025 (+70.67%). Median DOM rose from 57 to 104 days (+82.46%). YTD 2025 average DOM is 96 days, up 15.66% from 83 in 2024.
Analysis: Longer DOM reflects buyer selectivity, particularly in mid-range properties.
Implication: Sellers may need to adjust pricing or enhance marketing to reduce DOM.
Market Segment Analysis
Lower Price Range ($250,000–$499,999): Strong demand persists, with YTD sales growth in the $350,000–$399,999 (+137.5%) and $450,000–$499,999 (+66.7%) ranges.
Mid-Price Range ($500,000–$999,999): Accounts for 43.9% of September 2025 sales and 47.5% of active listings, with robust sales growth in the $950,000–$999,999 range (+300%).
Upper Price Range ($1,000,000–$2,999,999): Stable sales but declining in sub-segments like $1,000,000–$1,099,999 (-50% YoY), with growing inventory.
Luxury Market ($3,000,000+): Sales slowed, with only 1 sale above $3,000,000 in September 2025, reflecting limited demand.
Year-over-Year Comparison
2025 YTD vs. 2024 YTD: Absorption rate up 17.29%, average list price down 4.38%, average sale price down 6.14%, median sale price down 6.93%, sold listings up 0.5%, pending listings down 6.4%, active listings up 6.0%.
September 2025 vs. September 2024: Absorption rate up 10.75%, average sale price down 13.35%, median DOM up 82.46%, sold listings up 17.9%, pending listings down 25.0%.
Market Outlook
The Key West to Big Pine Key market is shifting toward a buyer-friendly state, with increased inventory and softening luxury prices balanced by mid-range demand. Buyers have more options in the $500,000–$999,999 segment, while sellers face competition above $1,000,000. The $250,000–$499,999 range remains active for first-time buyers and investors.
For Buyers: Explore the $500,000–$999,999 range for abundant inventory and softening prices. Focus on $350,000–$499,999 for affordability-driven opportunities.
For Sellers: Competitive pricing is key for properties above $1,000,000, while mid-range sellers can leverage demand with realistic pricing. Luxury sellers may wait for better conditions.
Economic Factors: Interest rates and South Florida economic trends will shape future demand.